
The BCG matrix framework by Boston Consulting Group evaluates the strategic position of the products in the portfolio of a business.
While the Product Life Cycle is a great tool to determine how one or a group of products in the portfolio are doing, tools such as the BCG (Boston Consulting Group) Matrix are better at providing a current “snap shot” of how the products in the portfolio are performing.
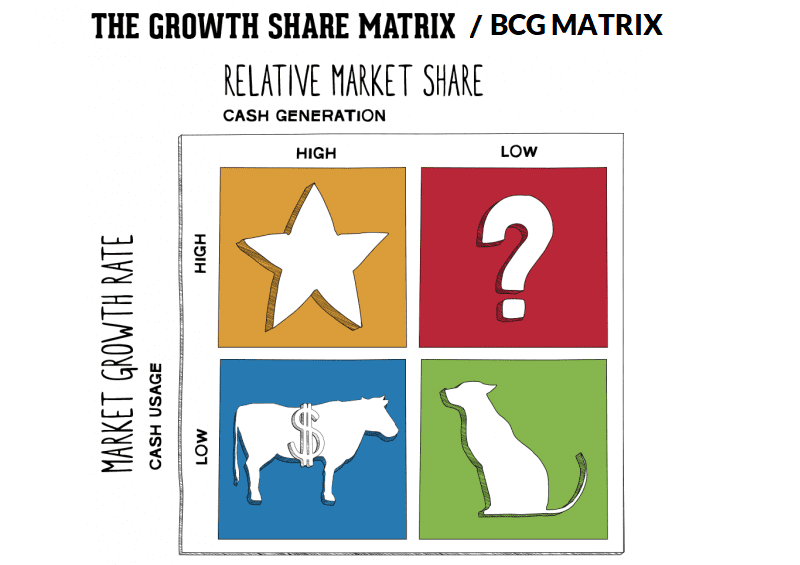
The Growth–share Matrix (also known as the Product Portfolio Matrix, Boston Box, BCG-matrix, Boston Matrix, Boston Consulting Group Analysis, Portfolio Diagram) is a chart that was created by Bruce D. Henderson for the Boston Consulting Group in 1970 to help corporations analyze their business units and their product lines.
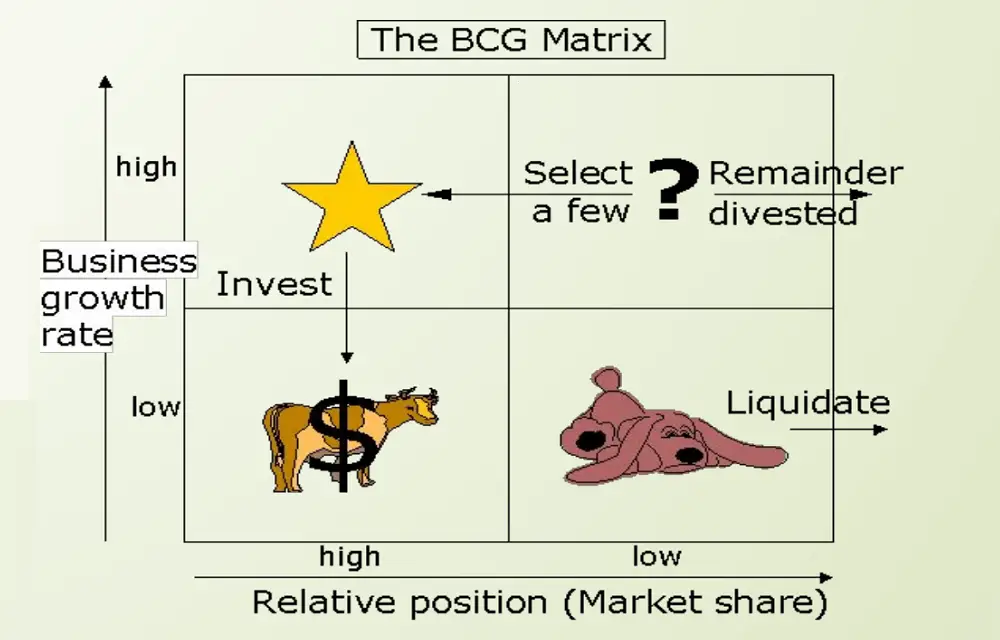
In the matrix, market growth and market share of the products (or service) of a company are compared to each other. This allows a company to determine whether they should invest in a product or whether they should deinvest, or even stop the product altogether.
Thus it helps the company allocate resources and is used as an analytical tool in brand marketing, product management, strategic management, and portfolio analysis.
Example of Boston Consultancy Group Matrix
- Stars (High Market Share) (High Growth Rate): Explain which products have high market share and high growth rate with data and with reasons.
- Question Marks (Low Market Share) (High Growth rate): Explain which products have low market share but, have the capacity to grow in further. For example, you will take any product of each company which has high growth rate with reasons and why
- Cash Cows (High Market Share) (Low Growth Rate): Product that has high market share (data) and is currently not growing (low growth rate) with data and give reasons like to customer reviews, Dealer/distributor reviews
- Dogs (Low Market Share) (Low Growth Rate): Explain which product has low market share and low growth rate and give reasons linked to: Low demand, Low prices, Low sales, Low growth rate

High Growth – Low Market Share (Question Marks)
- Products in this cell are in fast growing markets but their relative market share is low.
- Question Marks are products that grow rapidly, consume large amounts of cash, but don’t generate much cash.
- Requires heavy investment and other capabilities, it has the potential to gain market share and become a star, and eventually a cash cow when the market growth slows.
High Growth – High Market Share (Stars)
- Stars are promising as they generate large sums of cash because of their strong relative market share.
- Stars consume large amounts of cash because of their high growth rate.
- Stars are usually profitable and would be future cash cows.
- If a star can maintain its large market share it will become a cash cow when the market growth rate declines.
Low Growth – High Market Share (Cash Cows)
- As the market matures or when the market growth rate becomes low the stars would rather become cash cows.
- Cash cows are high market share businesses in slow growth industries that do not normally require significant re-investment.
- As leaders in a mature market, cash cows generate a lot of cash which may be used to finance the development of stars and question marks.
- Cash cows tend to grow at a slow rate, but they are usually market leaders in the industry where there are lot of entry barriers. The presence of entry barriers means that there will be competition.
Low Growth – Low Market Share (Dogs)
- Product in this cell are called dogs, they may produce low profits or loss.
- Dogs have a low market share and a low growth rate and neither generates nor consumes a large amount of cash. Dogs may be considered for divestment.
- Dogs may be providing crucial inputs to stars, question marks or cash cows, they may be necessary to complete the product range, they may be held to keep competitors out, or for reasons like goodwill, sentimental factors etc.


BATheories.com is managed by a group of educators from Mumbai. We also manage the website StudyMumbai.com. Our panel includes experienced professionals and lecturers with a background in management. BATheories is where we talk about the various business theories and models for BA (Business Administration) students.